Well, the nightmarish month of January is finally over. What a month it was, with the stock markets reeling because of concerns about China’s economic growth rates and falling oil prices. Fortunately, stocks ended the month with a big recovery surge, with the Dow climbing over 1,000 points from the intra-day low touched on January 20th. We’re cautiously optimistic that the lows may have been reached for this correction.
For most of the month, the stock markets seemed to be directly tracking the ups and down of oil prices, which was highly unusual, to say the least. Usually oil and stock prices have very little correlation to each other, and if there is any correlation at all, it’s usually negative. When oil goes up, it is usually negative for stocks, and when oil prices come down, it acts like a tax cut for most consumers because we have more to spend on other things when filling our gas tanks is less expensive. But in the topsy-turvy market we’ve found ourselves in so far this year, lower oil prices are bad and higher ones are good. This makes some sense because prices that are too low put the hurt on oil producing areas of the country and the companies in the oil industry.
Today, the stock markets seem to have disconnected from oil prices once again. Oil is down 5% today, but the markets were basically flat. Go figure.
I do want to prepare you for some “statement shock” when you receive your Schwab statements in a few days. While stocks worldwide were down between 6-7% in January, our client accounts were down somewhere in the 2-4% range, depending on the risk/return profile of each client. Nobody likes seeing this kind of a start to a new year, and after two lackluster years in a row in 2014 and 2015, who could blame you for feeling downhearted. And with that tsunami of incredibly negative reports and predictions we had to endure in the press last month, you might be wondering why on earth you should even be invested in stocks at all.
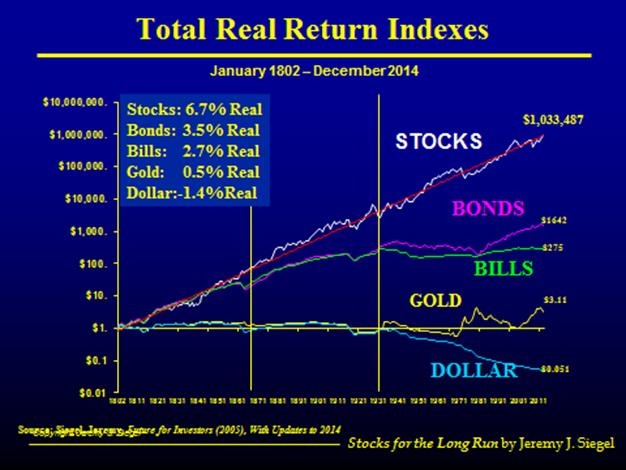
Let me tell you why you not only should, but you must stay in stocks. First, look at the graph below, showing the performance of the U.S. stock market from 1802-2014 (Source: Siegal Jeremy, Future for Investors (2014)) a period of some 212 years, extending all the way back to when Thomas Jefferson was president. This chart shows the “real” (inflation-adjusted) returns for various asset classes in the U.S. As you can see, stocks have generated a “real,” after-inflation return of 6.7% annually, far exceeding all other major asset classes.
What I want you to notice is how closely stocks appear to track the 6.7% line “real” annual return on the graph. The actual returns just seem to weave around, above and below this line for two centuries and running. To me, this exposes the big lie the media is trying to push down our throats that stocks are massively risky. For sure they are risky in the short run, but in the longer run, over periods such as the decades a couple spends in retirement, it’s hard to imagine anything more reliable in creating real wealth. Indeed, nothing has come close.
To really drive this point home, consider that I have been in the investment advisory business for over 30 years now, starting in 1985. During my career alone, I have seen many, many stock market disasters, including a one-day market crash of 22% (October, 1987), 9/11, two mega-crashes of close to 50% (2000-01 and 2007-09), several recessions, and more market corrections like last month’s than I care to remember. With all of those seeming calamities, you might wonder if an investor would have made even a penny in stocks over those 30 years. Yet the reality is that the S&P 500, with dividends reinvested, is up 25-fold during my career. What’s more, U.S. small cap stocks are up 41-fold. Small cap value stocks in the US, like what we have in your portfolio, are up 65-fold since 1985. International small cap value stocks, also like what you own, are up 55-fold, and emerging markets stocks are up 33-fold since 1989, when records first started being kept (source 2015 DFA Matrix Book).
So, remind me what exactly we are supposed to be worrying about? These blips and blaps in the market are NOT the story. In fact, they are completely normal! So why all the anxiety and focus on short-term performance? It is just so meaningless in the longer run. It does serve one very important function, though; fear of market volatility keeps many would-be participants out of the markets, thus concentrating the returns among those willing to stick it out and ignore the temporary reversals like January, and like the flat markets we’ve experienced over the past couple of years.
I also recommend reading this brief article entitled, Why does Pessimism Sound so Smart? It has another great graph that shows the average American’s personal income growth going back to 1790. I think it will provide you with additional comfort that, “all is well.”
Feel free to call us with any comments or questions about the markets, your planning, or your portfolio.
Thanks, and keep the faith!
Richard Del Monte
Are you looking for life-long financial planning support beyond traditional wealth management? Then Del Monte Group is the right place for you. At DMG, we address a client’s entire lifestyle to help make all goals become a reality–even if they aren’t directly related to money. Our clients are more than just assets and investments. They are human beings with their own stories, and they are our family. So, when you’re in the greater Alamo or Danville, California area our door is always open to assist you in person Call us at 925.736.6410, send an email to Info@APlaceOfPossibility.com, visit APlaceOfPossibility.com/Calendar to get your meeting on the books. We can't wait to help you.